Loading...

While Dutch cities are celebrated for their livability and social equity, they also hide a stark truth: social groups sometimes live worlds apart. This is especially true when looking at the population with a migration background. Unfortunately, this divide isn't just geographical; it hampers integration, perpetuates existing inequalities, and fuels fragmentation within society. Let's take Amsterdam as an example!
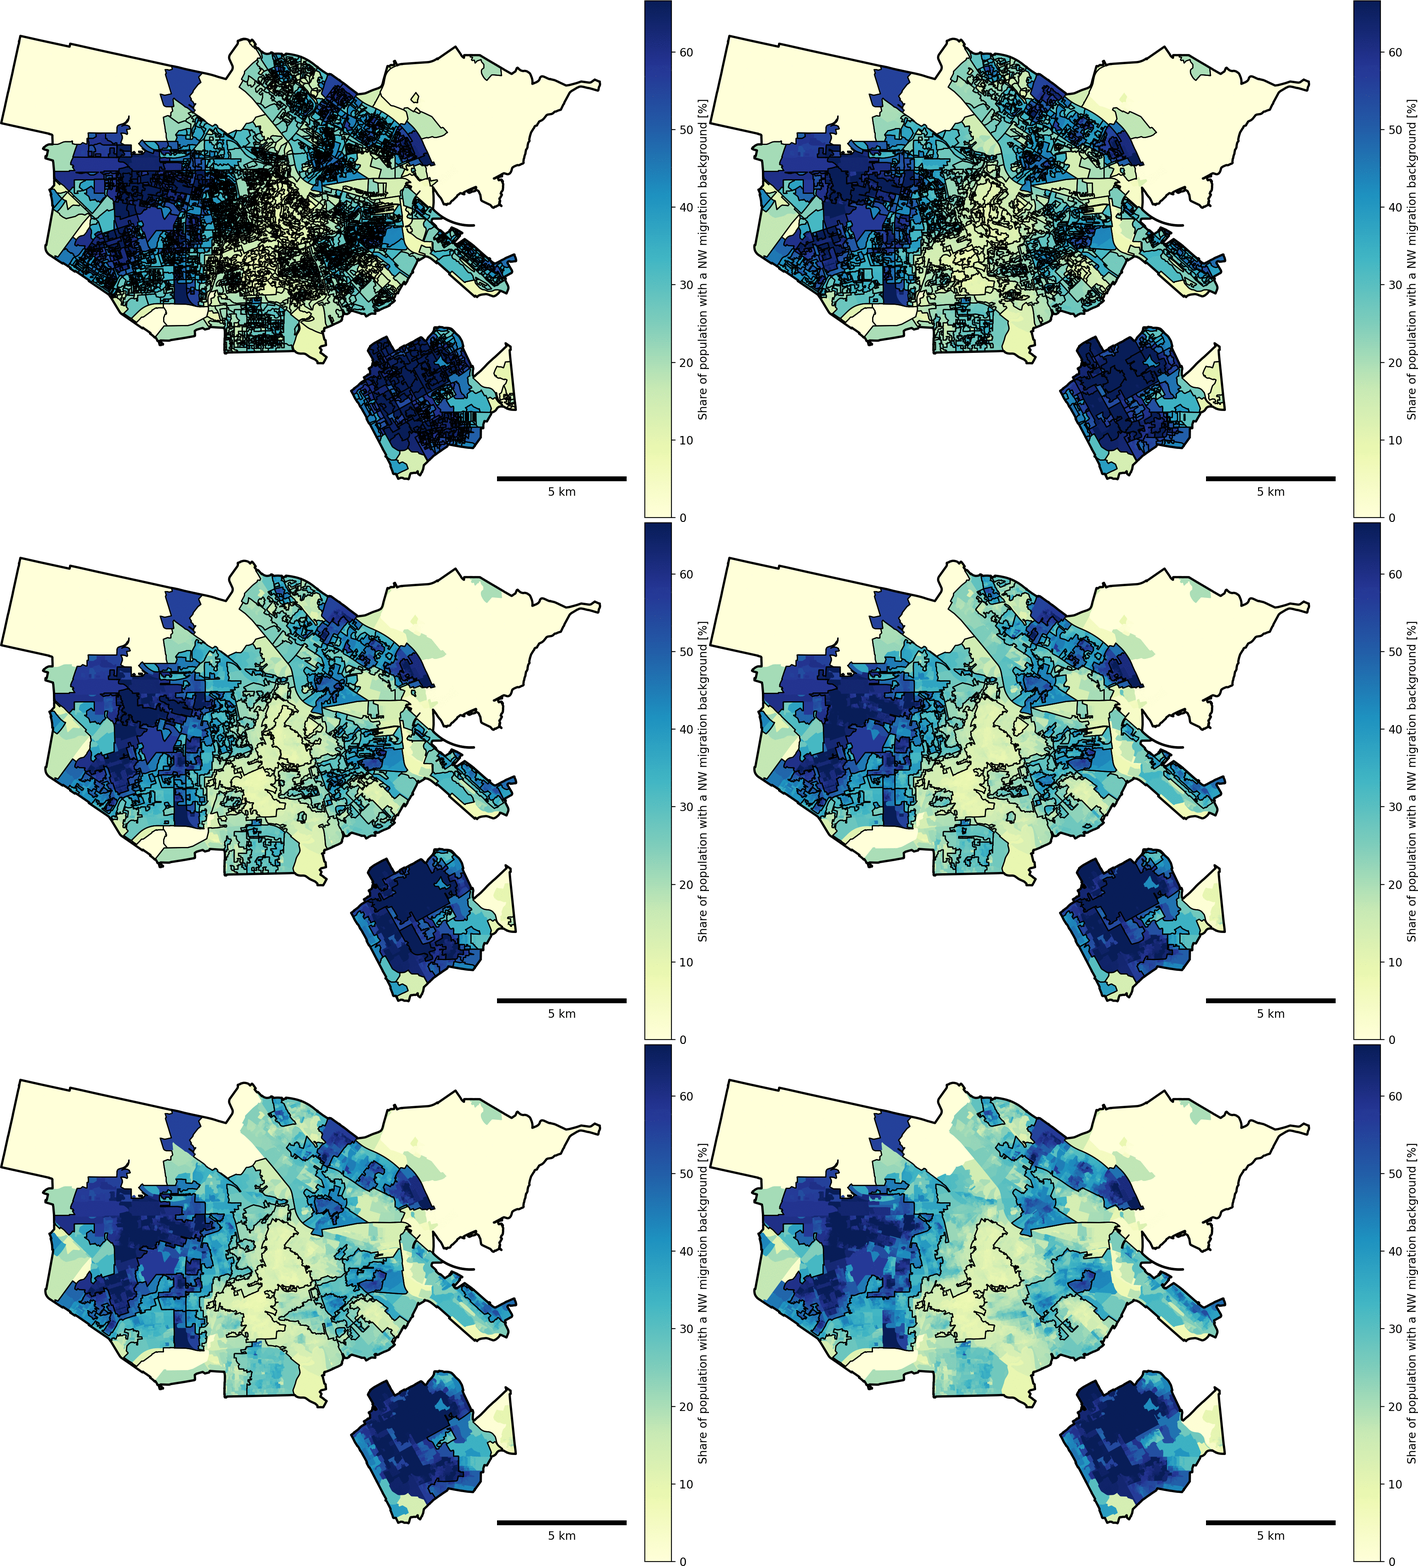
In 2020, there were 873,000 inhabitants in Amsterdam.
Of which 36% had a non-western migration background.
These two groups are not evenly distributed in space. There is residential segregation.
These regions over-represent the population with a non-western migration background, while the other parts of the city over-represent the other group. This phenomenon can be quantified along several dimensions.
Intensity is the extent to which a group is over-represented in certain regions.
The scale of segregation is the size of these regions. The larger it is, the lesser opportunities for interactions.
Separation is the share of the group living in a segregated region.
We use AI to delineate segregation regions. Then, we can quantify segregation along the three dimensions: intensity, separation, and scale.
AI-based regionalization of segregation patterns in Dutch municipalities
We have done that for all municipalities larger than 50,000 inhabitants in the Netherlands, in 2015 and 2020.
In 2015, intensity is highly correlated with the share of the population with non-western migration background, called residential mix on the plot.
Scale is correlated with the city size.
Separation is lower in the Randstad.
Between 2015 and 2020, we observe a convergence in segregation patterns, in terms of intensity.
It increased in municipalities with a low intensity in 2015.
And decreased in municipalities with a high intensity in 2015.
We observe a similar pattern for separation.
Then, we investigated how the increase in the share of population with a non-Western migration background relates to changes in segregation patterns. The population with a non-western migration background increased in all municipalities considered, and was particularly high in suburban towns in the vicinity of Amsterdam, the Hague, and Rotterdam.
The increase in the share of population with a non-western migration background did not result in an increase in intensity.
However, we notice a correlation with separation.
And a correlation with scale. Hence, where the share of population with a non-western migration background increased the most, social enclaves did not become more homogeneous. Instead, they grew in number and in size.

Further Research and Publication

This work led to a scientific publication, consult it for more details! If you are interested in the results, please contact me at contact-me@lucas-spierenburg.eu.

Details

Written by Lucas Spierenburg
Supervised by Sander van Cranenburgh and Oded Cats
at the TU Delft, 2023

References

Paper
Code
Data

Credits

Raw data from CBS and OpenStreetMap.
Analysis conducted using scikit-learn, Geopandas, and OSMnx.
Data story realized with d3.js and scrollama.

Copyright © Lucas Spierenburg 2025