Characterizing residential segregation patterns in the Netherlands
Introduction
Residential segregation is a major issue for local, regional, and national authorities, as it often exacerbates existing inequality across groups in many aspects of people’s life (e.g. education achievements, well-being, and health condition). These authorities need tools for characterizing residential segregation, as well as understanding its underlying determinants, in order to tackle this issue adequately.
In this project, I address this need. I propose a method to characterize residential segregation patterns. It can be used on a single case study, to identify segregated regions in a city. I propose to apply it systematically to all Dutch municipalities, to identify trends in residential patterns. In the future, I plan to use these results to investigate the causes of segregation, and to suggest urban development strategies mitigating residential segregation.
I use this method to study the segregation of migrants and children of migrants in the Netherlands, using fine-resolution demographic data from the Dutch statistics office (the spatial units are the Dutch 6-digits postcodes). I use data for the year 2017.
Identifying a spatial pattern
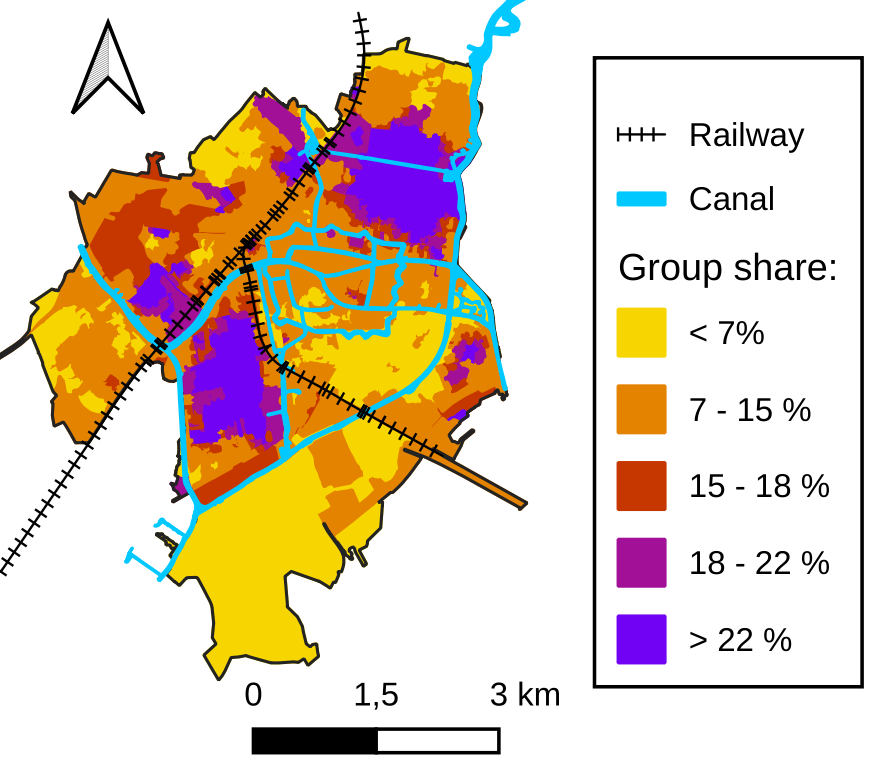
The map in figure 1 displays the spatial distribution of individuals that are either migrants or children of migrants in the city of Leiden. One can see that the distribution is not even in space (the city average is around 15 %). We can easily identify regions on the map where migrants and children of migrants are over-represented. By hovering over the map, you can identify these regions.
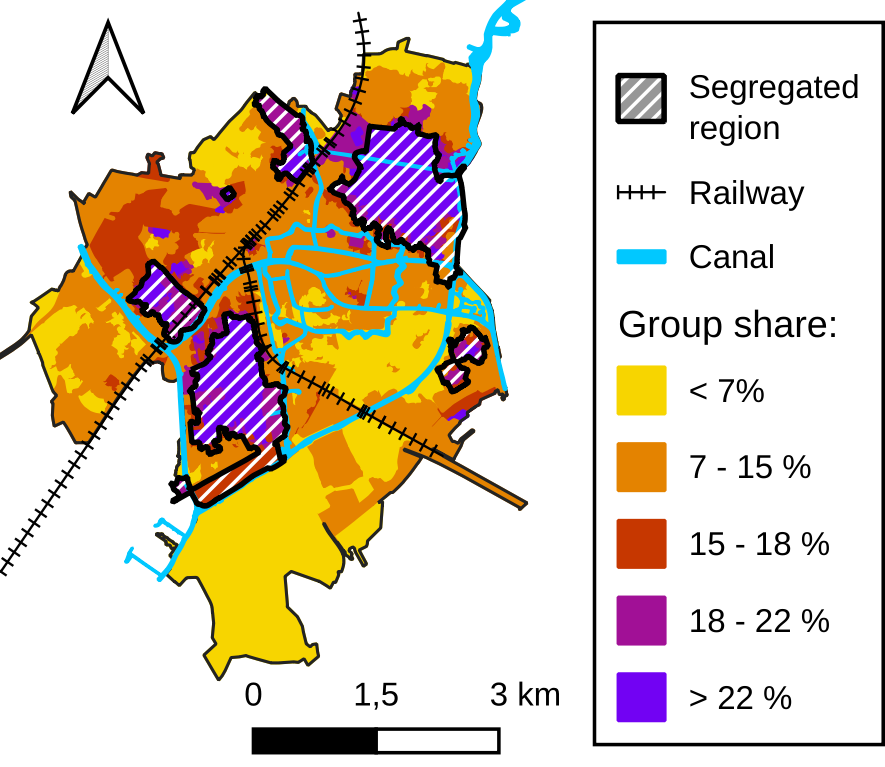
To study how patterns vary from one municipality to another, one could draw by hand such regions for every municipality in the Netherlands. However, the task would be tedious. Instead, we propose to use machine learning to build regions that are homogeneous in terms of demographics.
Such a task is called regionalization. The objective is to unravel a certain spatial pattern in the data. In this work, we use agglomerative clustering, with spatial constraints. At first, we consider all spatial units as independent regions. Regions are then merged iteratively. At every iteration, the variance within regions increases, and we perform the merging operation that minimizes this increase. We stop the merging process when regions are too dissimilar to be merged. Figure 2 below illustrates this process.
One note: In our case study, there are high spatial fluctuations in the data, a preprocessing step is needed (see this paper for more details).
Characterizing a certain segregation pattern
Now that we can identify residential segregation patterns, we need to characterize them with a set of indicators. I propose three indicators: intensity, separation, and scale to perform a meaningful comparison across cities.
Intensity

Intensity indicates the over-representation of a group in segregated regions. We compute the average share of the group in segregated regions and compare it to the city average.

Separation

Separation indicates the share of the group of interest living in segregated regions.

Scale

The scale indicates the spatial extent of segregated regions. We measure the population living in each segregated region and find the median. This indicator can be expressed in absolute terms (number of inhabitants), or relative terms (compared to the city population).

Results: Segregation patterns in the Netherlands
We apply the regionalization method to identify segregation patterns in all municipalities in the Netherlands. Then, we compute the three indicators for each municipality. Figure 3 below represents the three indicators for each municipality. In this scatter plot, an observation corresponds to a municipality. Intensity is represented by the color of the circle, separation is on the x-axis, and relative scale is on the y-axis.
This figure is interactive. If you would like to know more about a particular observation, hover over it and find out about the name of the municipality, and display the segregation pattern on a map. You can also select a particular municipality with the drop-down menu, and identify it on the map.
This figure shows that a great diversity of segregation patterns exist in practice. Some municipalities like Losser at the bottom left of the figure show low intensity, low separation, and low relative scale, some at the top right like the Hague show high intensity, high separation, and high relative scale, while some others like Alkmaar show high intensity, high separation, and low relative scale.
Results: Association with city characteristics
After characterizing the segregation patterns in all Dutch municipalities, we can explore how they relate to city characteristics. In the scientific literature, segregation is often associated with city size, the proportion of the group of interest in the population, and income inequality. In figure 4 below, we plot how each of these characteristics relates to each dimension of residential segregation. You can select which variables to set for the x and the y axis using the two drop-down menus. You can also hover over an observation to get the name of the municipality.
Here, we observe that larger, more mixed, and more unequal municipalities show higher segregation intensity and separation, and a larger absolute scale. This result is consistent with the scientific literature. However, this association between segregation patterns and these three variables may be three manifestations of a similar underlying phenomenon. City size, social mix, and income inequality are correlated variables.
Conclusion
Our method successfully identifies and characterizes residential segregation patterns. It can be used to assess systematically residential segregation in a set of cities. In future work, I will study how these patterns evolve over time and investigate how urban development led to certain segregation patterns.
More details on the method and result are available in this paper. Please refer to that paper when citing this work.
Details
Written by Lucas Spierenburg
Supervised by Sander van Cranenburgh and Oded Cats
at the TU Delft, 2023
Credits
Raw data from CBS and OpenStreetMap.
Analysis conducted using scikit-learn, Geopandas, and OSMnx.
Figures realized with d3.js.